Solving the Data Problem in driving growth: What are some problems data can help solve
We live in an age where everyone is connected 24/7. Where almost everyone owns a smartphone and spends an average of 3 hours and 15 minutes per day on their phones.

Did you know that by the mid-2010s, annual data production had far surpassed the total data generated in all of human history up until then.
Recent sources suggest the growth rate of data itself is increasing consistently, and now more recently at an incredible rate.
Naturally most of this is driven by the internet and associated technology. If we look at the split of online data creation sources we get something like the below
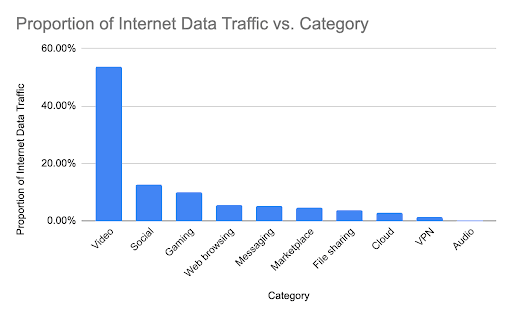
Note: Video accounts for more than 50% (Think TikTok, Instagram, YouTube etc)
So, what is a business to do with this much data! Don’t panic, just take a step back and follow good planning processes. We like to use a combination of two strategic frameworks whenever we are tackling a business problem. These are SOSTAC (Situation Analysis, Objective Setting, Strategy Development, Tactics, Actions, Controls) and RACE (Reach, Act, Convert, Engage).
We find the latter is better suited to digital marketing but the former we have applied to many situations. In terms of where we are now is the Situation Analysis. This means understanding where you are right now in whatever business process you are looking at. Because we are looking at data we need to pose a problem that we can look into solving. Once we do that we can start looking at solutions. Here are some examples of how a business can tackle the marketing data issues they may be having.
First problem:
For example, let's say that BusinessA is an Ecommerce business that spends a fair budget monthly on advertising through Google Ads and Meta ads (Facebook and instagram). They have gone through the exercise of installing Google Analytics and the Meta Pixel on the site to collect data through Google Tag Manager (A system used to manage marketing data scripts without having to bother the developers each time). Additionally, they have connected the Google Ads account to the Google Analytics account to pass conversion data. In general their setup is done and is good. Within Google Tag Manager they have created specific conversion tags and data collection points. With all of this they know they have:
GA4:
Site interaction data (users, sessions, events)
Behaviour data (avg session duration, engagement rate, events per session)
Ecommerce data (Items viewed, items added to cart, items sold)
Conversion data (Transactions, Revenue, Discounts)
Google Ads:
Campaign performance (Clicks, impressions, cost per click)
Conversion data (sales and revenue)
Ad performance data (quality)
Keyword data
Meta Pixel:
Campaign performance
Conversion data (sales and revenue)
Ad performance (Top ads)
Interaction data
CRM:
Final sales data (Revenue and transactions)
Failed sales
Item data (product performance)
User data:
Customer Name
Customer email
Customer address
Purchase activity
All things being equal (or as my economics lecturer used to say,”ceteris paribus”) BusinessA has all the required data points, which is great, but the questions they need to answer are not being answered in the data.
In particular the following scenarios are occurring:
Sales data between Google analytics and the CRM do not match
The sources of conversion between Google Analytics and the CRM do not match
Channel data in Google is much better than the CRM but when looking at the actual conversion values there is a misalignment
Meta’s conversion data is way off of Google Analytics
There is no way to tell which channel has the best retention rate through the sales process
The marketing team are struggling to tell where people are dropping off and the effectiveness of the checkout process
The exco are not convinced that the ad spend is successfully creating sales
Pretty common problems right, let's tackle them in steps:
Step 1: Matching data in Google and the CRM.
The most common issue is that these two data platforms do not align and the most accurate data for various points exists in one or the other but not both. The team needs these to align to make good decisions. Ok great. So there are two specific options you can use here:
When a user enters the site, capture and store the source and medium they enter the site on a UTM (Try out a Free UTM builder from Dynamite Agency, our in house development business) in either a cookie or session storage api and persist it until a sale occurs. At this point the data is sent to the CRM WITH the sales data and stored in a custom field/s for greater channel accuracy.
However, keep in mind Google Analytics filtering and sampling, this may also be a reason for the mismatch:
Google Analytics may exclude certain transactions due to:
Sampling thresholds in reports
Users rejecting tracking cookies (GA4 relies on modelled data)
Differences in session expiration times
Refunds or cancellations reflected in the CRM but not in GA
This is an option and can work but requires a fair knowledge of JavaScript and interacting with a user's browser. There is also margin for error and a risk of the script not firing or firing incorrectly and then you lose the source data.
Blend data from the CRM and Google Analytics on a common key/s. If you think about ecommerce and elements that exist in both the CRM and Google Analytics you should be thinking OrderIDs and Dates. So, here you have two keys you can use to combine the data from each system and thereby enrich the data set for greater accuracy. Blending the data means combining each set into a single new set of data
This option is much more stable overall and will likely give you more accurate results which you can better rely on. In this way, you combine the best of both datasets into one new set. In this case you will be better able to identify which channels are responsible for conversion and the value of each channel. In this way your calculations such as ROI and ROAS (Return on ad spend) are likely more accurate. The requirement here though is the ability to blend the data. First, you will need to surface the data from each source (make it available to one another), then you will need to combine it together using the keys (OrderId and Date) and lastly you will need to visualise it so it can be used.
You will likely need an analyst who can assist you with this but there are great tools to perform these sorts of blends. You will likely need an ETL (Extract, Transform, Load) and visualiser for reporting which we mentioned in our previous article in case you missed it. (Read here about some ETLs we use)
Outcome:
BusinessA should now have not only a robust marketing data setup but an effective means of interpreting and using the collected data. Now they can attribute actual sales to channels and will be able to see which channels convert at what rates and at what values. Additionally they will be able to tell which channels have the highest failure or refund rates and adjust accordingly. They will also be able to better back track performance data to both Google ads and Meta ads and thereby get a far more accurate view on ROAS (Return on Ad Spend).
BusinessA can now advertise more effectively by focusing on top channels, ads, users and products. Solving the data problem for ads means that BusinessA will have greater growth and derive far more value from their marketing data.
Second problem: Meta and GA4 don’t align
This is very common and not unexpected. The big one to remember here is the attribution models each tool uses and the way you consider your data. Let's take Meta’s reporting first from a conversion perspective (which tends to be the result most focused on by a business).
In an attribution model, a conversion can be allocated in different ways over different time periods. As an example a “Last Click” attribution model will give all value of the conversion to the channel that led a user to the final conversion. So we would then say this is the most valuable channel. However, a Data Driven model will attribute a portion of the conversion to each channel in the conversion process. So, if a user first visited the site from Facebook then left but came back on Google ads,a “Last Click” model would say that all value belongs to Google Ads whereas a “Data Driven” model would say that both Facebook and Google Ads should receive a portion of the conversion value.
Another consideration is time. Some models could use a 1 day click model meaning only conversions on the day a user clicked and converted will be considered for a specific channel/campaign. Others will use longer terms like a 30 day window meaning that conversion will be attributed to a channel/campaign that led a user to the conversion point within a 30 day window.
So, you should see now that depending on the models a specific platform uses, the data can vary quite dramatically.
Meta will take ownership of every order in which a Meta ad was included. So if a user saw an ad, clicked through to the site, and didn’t convert from Meta BUT came back within 7 days via Google Search and converted, Meta will take that conversion for itself. The same can happen if a user just saw an ad and converted. In this instance, Meta basically says that the ad contributed to the conversion, which may not be untrue. Additionally, Meta may attribute conversions even if a user simply viewed an ad, not just clicked on it. This is important to understand the value of just seeing the ad (We would suggest more than just this data point though to prove that).
On the other hand, Google Analytics uses the Data Driven model (unless you set the last click model) to analyse and report. This means it will allocate a portion of conversion to channels that lead to a user visiting the site and converting. It uses actual data from the account to generate a custom model that assigns conversion credit to different marketing touch points.
You should be able to immediately see that different models will give you different results. More than that there is little you can do on each platform to bring these numbers together. What you can do is try to understand the correlation between the platforms in the PATH to conversion within Google Analytics. If you go to your Advertising reports in GA4 you will see Attribution reports for paths and models. Using these two reports you can get a better understanding of the contribution of Meta to conversion as part of a path or using different models to see if there is a variance. This still won’t bring you to exact figures but analysing these reports and referencing the Meta data will help you paint a better picture of actual performance.
So there you have it. By surfacing and transforming data to be useful a business will be able to perform more effectively and efficiently in their Online Marketing and Advertising activities. Being a data led organisation may be a cliched term starting around 2012 but it is no less relevant today. In the end, why not have a look at the marketing efforts your business utilises and see what data sets are available to you. Think about the questions you could ask of this data and what the potential benefit to the business would be, then start looking at the required resources to achieve this.
Thank you for joining us on this three part journey to solving the data problem!
Wishing all the best in your data journey for greater success.
References:
https://www.statista.com/statistics/871513/worldwide-data-created/
https://explodingtopics.com/blog/data-generated-per-day
Definitions:
Attribution models
Attribution models refer to the frameworks or rules that determine how credit for conversions (sales, leads, or other desired actions) is assigned to different touchpoints in a customer’s journey. These models help marketers understand which marketing channels, campaigns, or interactions contribute the most to driving conversions and which ones are underperforming.
Here are common types of attribution models:
Last-Click Attribution: This model gives all the credit to the last interaction or click before the conversion. It's simple but can undervalue earlier touchpoints.
First-Click Attribution: The opposite of last-click, this model gives 100% of the credit to the first interaction that brought the customer into the funnel.
Linear Attribution: This model evenly distributes credit across all touchpoints in the customer journey. Each interaction gets equal weight, regardless of when it occurred.
Time-Decay Attribution: This model gives more credit to interactions that occur closer to the time of conversion, acknowledging that recent touchpoints are often more influential in driving action.
Position-Based (U-Shaped) Attribution: This model allocates 40% of the credit to both the first and last interactions, and splits the remaining 20% among the interactions in between.
Data-Driven Attribution: Often powered by machine learning, this model uses actual data and patterns to allocate credit based on the effectiveness of each touchpoint in the customer journey. It dynamically adjusts based on historical data and the behavior of different customers. GA4 defaults to a Data-Driven Attribution (DDA) model, but it still allows users to switch to Last Click, First Click, Time Decay, etc.
Attribution models are crucial in optimizing marketing strategies, allocating budgets, and understanding which channels deliver the best ROI (return on investment). Different models offer different insights, and many businesses test several to find the most accurate reflection of their marketing performance.
Contact
Share a bit of context and what you’re trying to achieve. We’ll come back with the most useful next step and help you decide on the smallest set of moves that improves clarity, delivery, and measurement.

